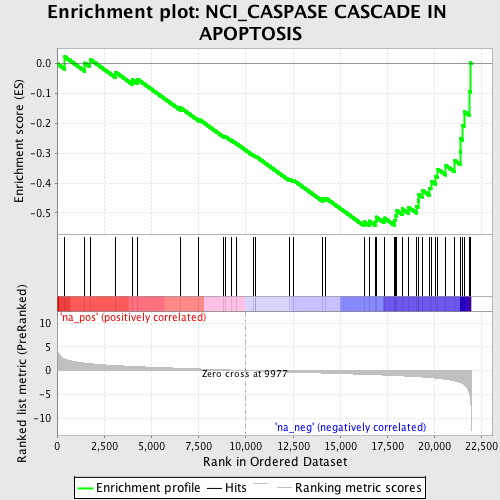
Profile of the Running ES Score & Positions of GeneSet Members on the Rank Ordered List
| Dataset | set02_ATM_minus_versus_BT_ATM_minus |
| Phenotype | NoPhenotypeAvailable |
| Upregulated in class | na_neg |
| GeneSet | NCI_CASPASE CASCADE IN APOPTOSIS |
| Enrichment Score (ES) | -0.543638 |
| Normalized Enrichment Score (NES) | -1.9456854 |
| Nominal p-value | 0.0 |
| FDR q-value | 0.028170658 |
| FWER p-Value | 0.219 |
| PROBE | GENE SYMBOL | GENE_TITLE | RANK IN GENE LIST | RANK METRIC SCORE | RUNNING ES | CORE ENRICHMENT | |
|---|---|---|---|---|---|---|---|
| 1 | CASP3 | 413 | 2.406 | 0.0228 | No | ||
| 2 | GZMB | 1463 | 1.577 | 0.0022 | No | ||
| 3 | CFL2 | 1742 | 1.467 | 0.0150 | No | ||
| 4 | TOP1 | 3099 | 1.061 | -0.0286 | No | ||
| 5 | SATB1 | 3979 | 0.876 | -0.0535 | No | ||
| 6 | CRADD | 4268 | 0.828 | -0.0523 | No | ||
| 7 | BAX | 6537 | 0.482 | -0.1475 | No | ||
| 8 | CYCS | 7517 | 0.351 | -0.1862 | No | ||
| 9 | LRDD | 8832 | 0.171 | -0.2432 | No | ||
| 10 | MAP3K1 | 8906 | 0.161 | -0.2437 | No | ||
| 11 | TNFRSF1A | 9263 | 0.111 | -0.2581 | No | ||
| 12 | DIABLO | 9521 | 0.071 | -0.2686 | No | ||
| 13 | APAF1 | 10407 | -0.066 | -0.3078 | No | ||
| 14 | LMNB1 | 10486 | -0.076 | -0.3101 | No | ||
| 15 | CASP1 | 10532 | -0.083 | -0.3107 | No | ||
| 16 | TRAF2 | 12318 | -0.311 | -0.3868 | No | ||
| 17 | LMNB2 | 12514 | -0.335 | -0.3899 | No | ||
| 18 | BIRC2 | 14071 | -0.516 | -0.4520 | No | ||
| 19 | TRADD | 14236 | -0.537 | -0.4502 | No | ||
| 20 | CASP8 | 16284 | -0.795 | -0.5299 | Yes | ||
| 21 | SREBF1 | 16535 | -0.827 | -0.5269 | Yes | ||
| 22 | RIPK1 | 16874 | -0.871 | -0.5273 | Yes | ||
| 23 | CASP4 | 16907 | -0.877 | -0.5135 | Yes | ||
| 24 | BIRC3 | 17339 | -0.944 | -0.5169 | Yes | ||
| 25 | BID | 17883 | -1.039 | -0.5237 | Yes | ||
| 26 | DFFA | 17956 | -1.052 | -0.5087 | Yes | ||
| 27 | PARP1 | 18005 | -1.059 | -0.4926 | Yes | ||
| 28 | CASP2 | 18290 | -1.111 | -0.4863 | Yes | ||
| 29 | BCL2 | 18625 | -1.179 | -0.4811 | Yes | ||
| 30 | GAS2 | 19048 | -1.271 | -0.4784 | Yes | ||
| 31 | CASP9 | 19125 | -1.289 | -0.4595 | Yes | ||
| 32 | DFFB | 19145 | -1.295 | -0.4380 | Yes | ||
| 33 | TNF | 19341 | -1.351 | -0.4235 | Yes | ||
| 34 | PTK2 | 19751 | -1.476 | -0.4165 | Yes | ||
| 35 | APP | 19814 | -1.503 | -0.3933 | Yes | ||
| 36 | ACTA1 | 20070 | -1.597 | -0.3773 | Yes | ||
| 37 | CASP6 | 20177 | -1.642 | -0.3537 | Yes | ||
| 38 | LIMK1 | 20601 | -1.848 | -0.3410 | Yes | ||
| 39 | NUMA1 | 21077 | -2.170 | -0.3251 | Yes | ||
| 40 | PRF1 | 21361 | -2.499 | -0.2947 | Yes | ||
| 41 | ARHGDIB | 21394 | -2.566 | -0.2517 | Yes | ||
| 42 | GSN | 21499 | -2.780 | -0.2083 | Yes | ||
| 43 | CASP7 | 21563 | -2.954 | -0.1600 | Yes | ||
| 44 | LMNA | 21836 | -4.610 | -0.0926 | Yes | ||
| 45 | VIM | 21890 | -5.636 | 0.0026 | Yes |
